

+1.43%
+1.13%
-1.70%
+1.57%
+0.09%
+2.58%
The Ichimoku cloud looks complex with five lines and a shaded region, but it’s a single unified indicator that reveals trend direction, momentum, and support/resistance levels in one glance. Learning its components transforms it from intimidating to indispensable.
The Five Components Explained
1. Tenkan-sen (Conversion Line)
This fast-moving line tracks short-term price momentum over 9 periods. Calculate it as (9-period high + 9-period low) / 2.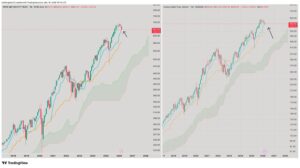
A steep slope signals strong momentum; sideways movement indicates ranging price action. Think of this as your short-term trend pulse.
2. Kijun-sen (Base Line)
The slower equilibrium line measures the midpoint of the past 26 periods: (26-period high + 26-period low) / 2. Traders use it to gauge trend strength and direction.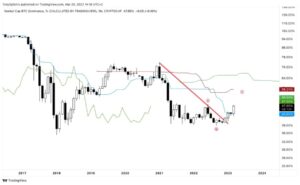
When Tenkan-sen crosses above Kijun-sen, it often signals bullish momentum — the classic TK cross entry signal.
3. Senkou Span A (Leading Span A)
This line averages Tenkan-sen and Kijun-sen, then plots it 26 periods forward into future chart space. Calculate as (Tenkan-sen + Kijun-sen) / 2 and project ahead. It forms one edge of the cloud’s shaded region, giving you forward-looking support/resistance.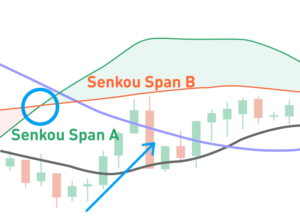
4. Senkou Span B (Leading Span B)
The second cloud edge uses a 52-period midpoint plotted 26 periods ahead: (52-period high + 52-period low) / 2. The shaded area between Span A and Span B is the cloud (Kumo), which acts as dynamic support and resistance projected into the future.
5. Chikou Span (Lagging Span)
Plot the current closing price back 26 periods in time. Compare it against past prices to confirm trend strength. If Chikou span is above historical price action, the trend is typically bullish. This provides historical context for current price movement.
The History Behind the Numbers
Developed by Goichi Hosoda starting in the late 1930s under the pen name Ichimoku Sanjin (“what a man in the mountain sees”), the system took over 30 years to perfect. Hosoda published his findings to the public in 1968, consolidating trend, momentum, support/resistance, and signal confirmation into one framework.
The name Ichimoku Kinkō Hyō translates to “one-glance equilibrium chart”—exactly what it delivers. The numbers 9, 26, and 52 were derived from the Japanese business calendar: 9 represented one and a half weeks, 26 was a standard business month (including Saturdays), and 52 equaled two months.
How to Actually Use It
Cloud position determines trend: Price above the cloud signals an uptrend. Price below the cloud indicates a downtrend. Price inside the cloud means the trend is flat or undetermined.
Cloud color matters: When Senkou Span A moves above Senkou Span B, the cloud typically turns green/bullish. When B moves above A, it turns red/bearish. Thicker clouds indicate stronger support/resistance.
TK Cross signals: A Tenkan-sen/Kijun-sen crossover above the cloud is a strong buy signal. The opposite crossover below the cloud is a sell signal. Crossovers inside the cloud are considered neutral or weak.
Chikou span confirmation: For a valid bullish signal, Chikou span should be above the price action from 26 periods ago. This confirms the trend has actual strength behind it.
Combining with Other Tools
Traders pair Ichimoku with volume indicators like on-balance volume or the Relative Strength Index (RSI) for confirmation. The cloud’s forward projection gives traders a unique edge: they see potential support and resistance before price reaches it.
For longer-term positions, combine it with fundamental analysis of the underlying asset. The indicator works across stocks, forex, commodities, and crypto—any liquid market with sufficient price history.
Getting Started
Master the five lines individually, then use them as a unified system. Start by watching Tenkan-sen and Kijun-sen crossovers for momentum shifts, then layer in the cloud for trend confirmation. Reference StockCharts’ Ichimoku documentation to practice on live charts.
The learning curve is steep, but the payoff—a complete market picture at a glance—justifies the effort. Most traders start simple: cloud color for bias, TK crosses for signals, Chikou span for confirmation. Add complexity as you gain experience.
I’ll be building a trading bot on crypto soon with the Ichimoku cloud as part of the strategies powering it, stay tuned
Follow Hashlytics on Bluesky, LinkedIn , Telegram and X to Get Instant Updates