-0.96%
-0.80%
-3.67%
+2,405.14%
-1.36%
-1.25%
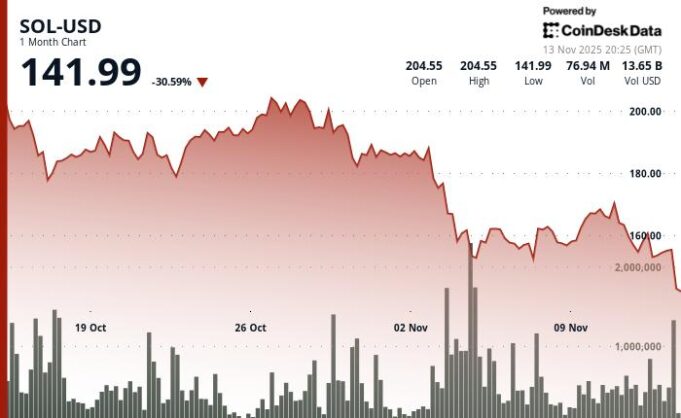
Solana‘s recent dip of 5% to $145 is more than just another red day in the cryptocurrency market; it potentially signals deeper issues within the SOL ecosystem. The key question now is whether this is a temporary setback or the beginning of a more significant decline.
Bears exerted significant pressure on Wednesday, breaking through a previously strong support level. Solana experienced a sharp price decrease, erasing the gains from the previous week in a single trading session. The rapid nature of this drop suggests a coordinated sell-off rather than a typical market correction.
The price breakdown was not gradual; it was a swift and cascading event. As the trading day neared its end, SOL entered a freefall, triggering numerous stop-loss orders that accelerated the downward trend. Each hourly closing price established new lows, clearly indicating bearish market control.
The final hour of trading was particularly severe, with SOL losing several dollars in just minutes. This wasn’t simply profit-taking; it represented a full-scale rout, suggesting that major investors were actively liquidating their positions.
ETF Inflows vs. Network Reality
Interestingly, this price decrease occurred despite seemingly positive news. Spot Solana ETFs have seen eleven consecutive days of positive inflows, with Bitwise’s BSOL leading, reaching total assets of $369 million. This implies institutional confidence, yet the network’s performance indicates a different trend.
Daily active addresses, a crucial indicator of network health, have fallen to a 12-month low of just 3.3 million. This contrasts sharply with the over 9 million users observed in January, highlighting a significant reduction in user engagement. The memecoin frenzy that once propelled Solana’s growth appears to have subsided, leaving a void in network activity.
This disparity between institutional investment and on-chain activity created substantial technical pressure. The market ultimately appeared to favor the more bearish outlook, resolving the tension with a sharp downward price movement.
The technical outlook for Solana is becoming increasingly uncertain. Critical support levels have been breached, and the prevailing trend appears to be downward. What specific price levels should traders be monitoring?
Support/Resistance
The $150 level, formerly a support, now acts as resistance, with the next major support floor lying between $142 and $144. A break below this range could lead to further losses. Expect strong resistance near $157.25.
Volume Analysis
The 2.49 million volume spike during the breakdown (157% above the daily average) confirms a pattern of institutional distribution. Large investors were selling, and the market absorbed the selling pressure.
Chart Patterns
A distinct bearish structure is forming, characterized by lower highs from the $157.25 peak and increasing downward momentum. This indicates that the downtrend is likely to persist.
Targets & Risk/Reward
The initial target is the $142-$144 support zone. If selling continues, a move towards $135-$140 becomes increasingly probable. Traders should carefully evaluate the risk/reward profile before initiating any new trades.
The Solana narrative is far from complete. While the recent price action is undoubtedly concerning, it’s important to acknowledge the inherent volatility of cryptocurrency markets. Solana’s ability to recover from this setback will depend on a complex interaction of factors, including network activity, overall market sentiment, and the continued interest of institutional investors. For the time being, caution is advised.


