Current evidence points developers toward testing GPT-6.1 Sol first when inference cost is the primary concern, since its pricing offers a clear edge for many workflows. Claude Opus 5.5, however, holds a measurable capability lead on demanding tasks and independent composite evaluations. The right pick depends entirely on the job.
Reading the Spec Sheets
OpenAI launched GPT-6.1 Sol on September 29, 2026, shortly after Anthropic released Claude Opus 5.5. Their API specifications show similar core capacities but notably different operational constraints.
| Specification | GPT-6.1 Sol | Claude Opus 5.5 |
|---|---|---|
| Direct API model ID | gpt-6.1-sol |
claude-opus-5-5 |
| API context window | 1,050,000 tokens | 1,000,000 tokens |
| Normal maximum output | 128,000 tokens | 128,000 tokens |
| Published knowledge cutoff | April 30, 2026 | June 2026 |
| Native input / output | Text and images / text | Text and images / text |
| API default effort | Medium | Medium; adaptive thinking always on |
Sol’s 50,000 extra context tokens give it a 5% advertised capacity advantage, though raw capacity doesn’t dictate retrieval effectiveness or whether a workflow actually finishes cleanly. Opus also supports up to 300,000 output tokens through its Message Batches API, a ceiling not available on ordinary interactive requests.
Where Sol’s Pricing Breaks
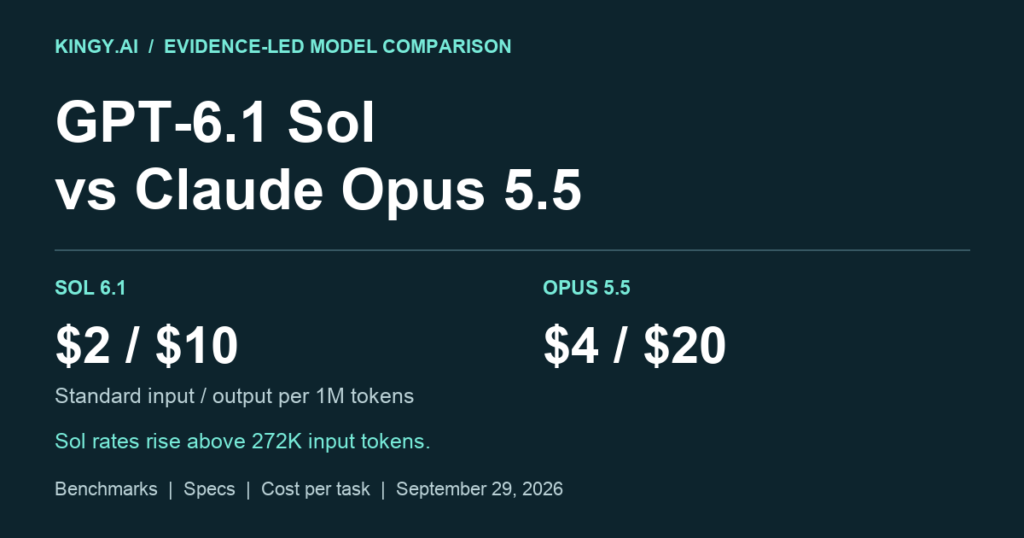
Sol offers real savings at standard rates, but there’s a threshold worth knowing before you build around it. Sol’s input runs at half price for prompts at or below 272,000 tokens. Cross that line, and Sol’s input and cache read rates land right where Opus already sits.
| Billable category | Sol: input ≤272K | Sol: input >272K | Opus: full context |
|---|---|---|---|
| Fresh input | $2.00 | $4.00 | $4.00 |
| Cache read | $0.10 | $0.20 | $0.20 |
| Cache write | $2.50 | $5.00 | $5.00 for 5 minutes; $8.00 for 1 hour |
| Output, including billable reasoning | $10.00 | $15.00 | $20.00 |
The threshold isn’t a rounding error. Take 272K fresh input tokens plus 20K output tokens, and the request costs $0.744 on Sol. Push the input just 1K tokens higher to 273K, and the same request jumps to $1.392, an 87% increase for one additional token over the line. Anthropic prices Opus’s full 1M context at a flat standard rate with no such cliff, which makes token compaction and retrieval discipline genuinely load-bearing for anyone building on Sol.
| Hypothetical usage | Sol | Opus | Sol saving |
|---|---|---|---|
| 10K fresh input + 2K output | $0.04 | $0.08 | 50% |
| 100K fresh input + 20K output | $0.40 | $0.80 | 50% |
| 100K cache read + 10K fresh input + 10K output; initial write excluded | $0.13 | $0.26 | 50% |
| 20 requests: first writes a 100K prefix; next 19 read it; each has 5K output; no other input | $1.44 | $2.88 | 50% |
| 400K fresh input + 20K output | $1.90 | $2.00 | 5% |
| 900K fresh input + 10K output | $3.75 | $3.80 | 1.3% |
Notice how Sol’s advantage collapses as input grows. At 10K tokens, Sol saves 50%. At 900K tokens, the saving shrinks to 1.3%, barely worth architecting around.
What the Benchmarks Actually Show
Independent evaluations from Artificial Analysis and Vals confirm Opus holds the capability lead. Artificial Analysis’s Intelligence Index v4.3.2 puts Opus at 58 points against Sol’s 52, both measured at maximum effort. Sol’s reported cost per index task, though, runs about 88% lower.
| Artificial Analysis metric | Sol, Max | Opus, Max with default fallback |
|---|---|---|
| Intelligence Index v4.3.2 | 52 | 58 |
| Weighted mean cost per index task | $0.72 | $5.98 |
| Total output tokens across index evaluation | 67 million | 260 million |
| Reported output generation speed | 66.8 tokens/second | 92.5 tokens/second |
The Vals Index v2.1 tells a similar story. Opus scores 66.97% accuracy against Sol’s 61.15%, again at Max effort, while Sol’s reported cost per test runs approximately 89.9% lower. These are composite scores built from multiple benchmarks, so neither number directly predicts how either model performs on your specific task.
| Evaluation / effort | Sol score / cost | Opus score / cost |
|---|---|---|
| GDP.pdf, Medium | 30.0% / $0.34 | 25.6% / $0.80 |
| GDP.pdf, High | 32.0% / $0.35 | 28.8% / $0.83 |
| AutomationBench 1.0.6, Medium | 31.7% / $0.19 | 29.5% / $0.65 |
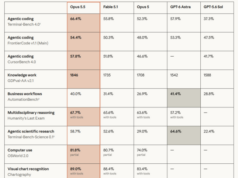
| AutomationBench 1.0.6, Max | 36.1% / $0.30 | 42.5% / $1.44 |
| Terminal-Bench Science 0.1, Max | 57.0% / $5.47 | 63.3% / $23.21 |
Worth noting from that last table: Sol actually beats Opus on three of the five individual benchmarks, including both GDP.pdf runs and AutomationBench at Medium effort. Opus only pulls ahead once effort is pushed to Max, and it costs considerably more to get there.
The Metric That Actually Decides This
Sticker price and benchmark scores both miss the number that matters most: cost per accepted task. That figure accounts for every attempt, retry, tool call, fallback, and infrastructure expense involved in getting a usable result. A cheaper model that frequently needs a second or third try can end up costing more than a pricier model that gets it right the first time.
| Your priority | Evidence-based starting point | What could change the choice |
|---|---|---|
| Frequent tasks under 272K input, with a clear acceptance check | Test Sol first; its base token rates give substantial budget room | More retries, tool calls, or repair work can consume the saving |
| Highest capability on the current independent index | Opus leads the reported Max-effort composite | Your task mix may differ from the index’s weights and grading |
| Difficult science or maximum-effort business automation | Opus has higher reported scores in the selected launch configurations | A fixed budget may buy more acceptable work from Sol |
| Large fresh document inputs with short output | Compare both; long-context inference prices can be close | Retrieval, caching, and source-grounding quality may dominate |
| Existing Codex or Claude workflow | Start inside the working integration and measure a candidate switch | Migration effort and tool differences may outweigh modest inference savings |
When tool fees, human repair work, or long-context pricing shift the ratio, the break-even point between the two models needs recalculating. There is no static winner here, only a winner for the task in front of you.
Hashlytics Take
Everyone is going to read the benchmark gap and call Opus the better model, and on paper it is. But the Terminal-Bench Science number tells the real story: Opus costs over four times more to win by six points. For teams running thousands of requests a day, that math rarely survives contact with a real budget. The smarter read isn’t picking a winner, it’s accepting that most production workloads should default to Sol and escalate to Opus only for the specific subset of tasks where accuracy failures are expensive enough to justify the premium.
Follow Hashlytics on Bluesky, Facebook, LinkedIn , Telegram and X to Get Instant Updates